In today's competitive real estate market, understanding buyer interest through 3D view of plots is the key to maximizing your land values. With Plotex's advanced 3D plot visualization and visitor tracking analytics, you can transform viewer behavior into actionable pricing strategies that increase your revenue by up to 30%.
The Power of 3D View of Plots for Land Value Optimization
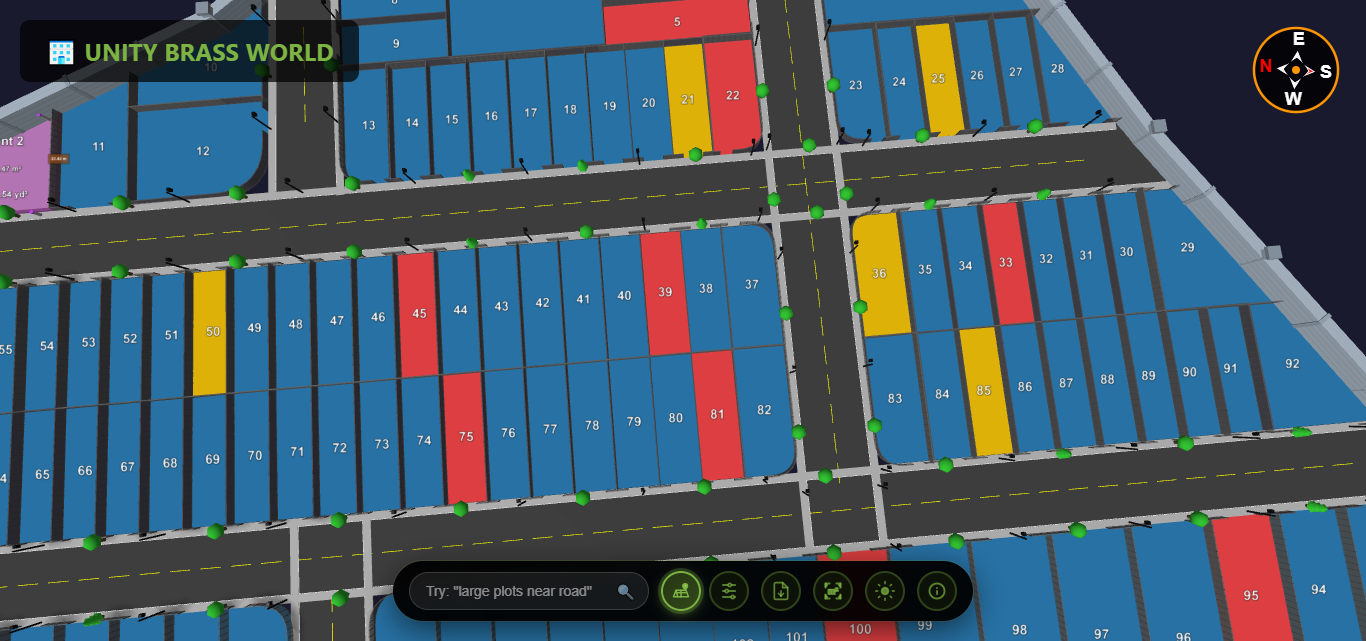
Every time a potential buyer interacts with your interactive 3D plot view, they're leaving behind valuable insights. Which plots do they spend the most time viewing in your 3D land plot viewer? Which angles do they explore? How many times do they return to view a specific plot?
This data is gold for real estate developers and sellers. Plotex's 3D plot visualization platform with built-in analytics tracks all of this automatically, giving you unprecedented insight into buyer behavior and preferences through advanced plot viewer analytics.
How 3D Plot Visualization Tracks Visitor Interest
Plotex's 3D view of plots platform includes intelligent tracking that monitors multiple data points to give you a complete picture of buyer interest through your interactive 3D plot viewer:
1. 3D Plot View Count Analytics
Track how many unique visitors view each plot in your 3D land plot viewer. High view counts on specific plots in the 3D view indicate strong demand - a clear signal that you can adjust pricing upward. The admin panel displays real-time view counts for every plot in your 3D plot visualization, making it easy to spot trending properties.
2. Interactive 3D View Time-on-Plot Metrics
Visitors who spend more time exploring a plot in the 3D plot view are showing serious interest. Plotex's 3D plot software measures average viewing duration per plot, helping you identify which properties are capturing attention in the interactive 3D plot view and deserve premium pricing.
3. Repeat Visitor Tracking
When the same user returns multiple times to view a specific plot, they're likely highly interested. Plotex's system identifies repeat visitors and flags plots with high return rates - these are your hottest leads and highest-value opportunities.
4. Geographic Location Data
Understanding where your visitors are coming from helps you:
- Identify regional demand patterns
- Target marketing campaigns more effectively
- Adjust pricing based on buyer demographics
- Understand your market reach
5. Inquiry Submission Tracking
Plotex correlates inquiry submissions with plot views, showing you which properties generate the most serious buyer interest. This data directly informs pricing decisions.
Real-World Example
A developer in Mumbai noticed that Plot #47 had 3x more views than similar plots in the same area. Using Plotex analytics, they identified strong demand and increased the price by 15%. The plot sold within 2 weeks at the higher price point, generating ₹12 lakhs in additional revenue.
Turning Data Into Profit: Pricing Strategies
Once you have visitor tracking data, here's how to use it to maximize plot values:
Strategy 1: Dynamic Pricing Based on Demand
Implement a demand-based pricing model:
- Identify high-traffic plots - Use Plotex analytics to find plots with view counts 50% or more above average
- Analyze viewing patterns - Look for sustained interest over 2-4 weeks, not just temporary spikes
- Incremental price increases - Raise prices by 5-10% for plots showing consistent high demand
- Monitor response - Track if higher prices impact view counts or conversion rates
Strategy 2: Create Scarcity Signals
When multiple visitors show interest in the same plot:
- Mark it as "High Demand" on your viewer
- Use the data to create urgency in your sales conversations
- Justify premium pricing with concrete visitor data
- Encourage faster decision-making from interested buyers
Strategy 3: Optimize Plot Presentation
Low-performing plots might just need better presentation:
- Analyze which plots get fewer views despite good locations
- Improve their 3D visualization, angles, or surrounding context
- Add features or amenities that make them more attractive
- Monitor if changes increase viewer interest
The Plotex Advantage: Admin Panel Features
Plotex's Admin Panel brings all this data together in one intuitive dashboard:
Key Admin Panel Capabilities:
- Real-time visitor dashboard - See current viewers, their locations, and which plots they're exploring right now
- Historical analytics - Track viewing trends over days, weeks, or months to identify patterns
- Plot performance reports - Automated reports showing top-performing and underperforming plots
- Lead scoring - Automatically score leads based on viewing behavior and engagement
- Inquiry management - Connect viewer data with inquiry submissions to understand buyer intent
- Export functionality - Download data for deeper analysis or integration with your CRM
Practical Implementation Steps
Here's how to start using visitor tracking to maximize your plot values:
Week 1: Establish Baseline
- Enable visitor tracking on your Plotex 3D viewer
- Collect initial data without making pricing changes
- Identify your top 5 and bottom 5 performing plots
Week 2-3: Analyze Patterns
- Look for consistent high-demand plots over 2-3 weeks
- Analyze geographic patterns in visitor locations
- Review inquiry-to-view ratios for different plots
- Identify correlations between views and actual sales
Week 4: Implement Pricing Adjustments
- Increase prices by 5-10% on consistently high-demand plots
- Create urgency messaging around trending properties
- Improve presentation of low-view plots
- Test different pricing strategies on similar plots
Ongoing: Monitor and Optimize
- Review analytics weekly to spot new trends
- Adjust prices based on sustained demand signals
- Use visitor data in sales conversations
- Continuously refine your pricing strategy
Case Study: Success with Data-Driven Pricing
A real estate developer managing a 200-plot township implemented Plotex's visitor tracking system. Within 90 days, they discovered:
- Corner plots near the main entrance received 4x more views than interior plots
- Plots with lake views had 60% longer average viewing times
- Visitors from urban areas spent more time on larger plots
- Weekend viewers showed 2x higher conversion rates than weekday browsers
Result: By adjusting pricing based on these insights, they increased overall project revenue by ₹2.4 crores while actually improving their sales velocity. High-demand plots commanded premium prices while data-backed pricing made other plots more competitive.
Beyond Pricing: Other Benefits of Visitor Tracking
The value of visitor analytics extends beyond just pricing optimization:
Improved Marketing ROI
Understand which marketing channels bring the most engaged visitors and focus your budget accordingly.
Better Customer Understanding
Learn what features and plot characteristics attract the most interest from your target buyers.
Sales Team Enablement
Equip your sales team with data about which plots are trending, helping them guide conversations and close deals faster.
Inventory Management
Make informed decisions about when to release new plot phases based on demand signals from the current inventory.
Getting Started with Plotex Visitor Tracking
Ready to start maximizing your plot values with data-driven insights? Plotex's Admin Panel makes it easy:
- Upload your plot layout to Plotex's 3D visualization platform
- Enable visitor tracking in the Admin Panel settings
- Share your 3D viewer with potential buyers through your website or marketing campaigns
- Monitor the dashboard to see real-time analytics and trends
- Implement pricing strategies based on demand signals
- Track results and continuously optimize
Pro Tip: Start Small, Scale Fast
Begin by tracking one or two key metrics (like plot view counts and time spent). As you get comfortable with the data, expand to more advanced analytics like repeat visitor tracking and geographic analysis. This gradual approach helps you build data literacy and confidence in your pricing decisions.
Conclusion: Data is Your Competitive Advantage
In an increasingly digital real estate market, visitor tracking isn't just a nice-to-have feature - it's a competitive necessity. Developers who leverage visitor data to optimize pricing can:
- Maximize revenue from high-demand plots
- Identify and fix underperforming inventory
- Make confident, data-backed pricing decisions
- Respond quickly to market demand shifts
- Provide better customer experiences
Plotex's comprehensive visitor tracking and analytics tools put this power in your hands. Stop guessing about buyer interest and start using real data to drive your pricing strategy.
The plots receiving the most views today could be your highest-value sales tomorrow - if you have the data to see it.
Ready to Maximize Your Plot Values?
Discover how Plotex's visitor tracking can transform your real estate business.
Explore Plotex Features