Whether you're buying property, inheriting land, or simply curious about real estate, understanding how to read a land plot map is an essential skill. These maps contain crucial information about property boundaries, dimensions, and legal descriptions that can significantly impact your investment decisions.
In this comprehensive guide, we'll walk you through everything you need to know about reading and interpreting land plot maps, from basic symbols to advanced measurements.
What is a Land Plot Map?
A land plot map, also known as a plat map or cadastral map, is a detailed drawing that shows the division of land into plots or parcels. These maps are typically created by licensed surveyors and are used for legal, administrative, and planning purposes.
Land plot maps contain several key pieces of information:
- Property boundaries - The exact lines that define where one property ends and another begins
- Dimensions - The length and width of the property in feet, meters, or other units
- Survey markers - Physical points used to establish boundaries
- Easements - Areas where others have rights to access or use
- Adjacent properties - Information about neighboring plots
Key Elements of a Plot Map
1. Scale and Orientation
Every plot map includes a scale that tells you how distances on the map relate to actual distances on the ground. For example, a scale of 1:1000 means that 1 centimeter on the map equals 1000 centimeters (10 meters) in reality.
The orientation is typically indicated by a north arrow. This helps you understand which direction the property faces, which can be important for factors like sunlight and views.
2. Boundary Lines
Boundary lines are usually shown as solid lines connecting survey points. These lines define the legal extent of the property. Pay attention to:
- Straight lines - Most property boundaries
- Curved lines - Often follow natural features or roads
- Dashed lines - May indicate approximate or disputed boundaries
3. Measurements and Bearings
Plot maps show the length of each boundary line, typically in feet or meters. Bearings indicate the direction of each line using compass directions (e.g., N 45° E means 45 degrees east of north).
Pro Tip: Always verify that the total measurements "close" - meaning if you follow all the boundaries, you should end up where you started. If the measurements don't close, there may be an error in the survey.
4. Survey Monuments and Markers
Survey monuments are physical markers placed at property corners. On maps, these are usually shown as small circles or squares. Common types include:
- Iron pins or rebar
- Concrete monuments
- Natural features (trees, rocks)
- Found monuments from previous surveys
5. Easements and Rights-of-Way
Easements are areas where someone else has the right to use part of your property. Common easements include:
- Utility easements - For power lines, water pipes, etc.
- Access easements - Allowing neighbors to cross your property
- Drainage easements - For water management
Common Symbols on Plot Maps
Understanding map symbols is crucial for accurate interpretation. Here are some common symbols you'll encounter:
- Solid thick lines - Property boundaries
- Dashed lines - Easements or setback lines
- Circles with crosses - Survey monuments
- Arrows - Direction of measurement or flow
- Hatched areas - Restricted zones or easements
Tips for Reading Plot Maps Effectively
- Start with the legend - Always check the map legend first to understand the symbols used
- Note the scale - Make sure you understand the relationship between map and ground distances
- Check the date - Older maps may not reflect current conditions
- Verify with physical inspection - Always walk the property to confirm what you see on the map
- Consult professionals - When in doubt, hire a licensed surveyor
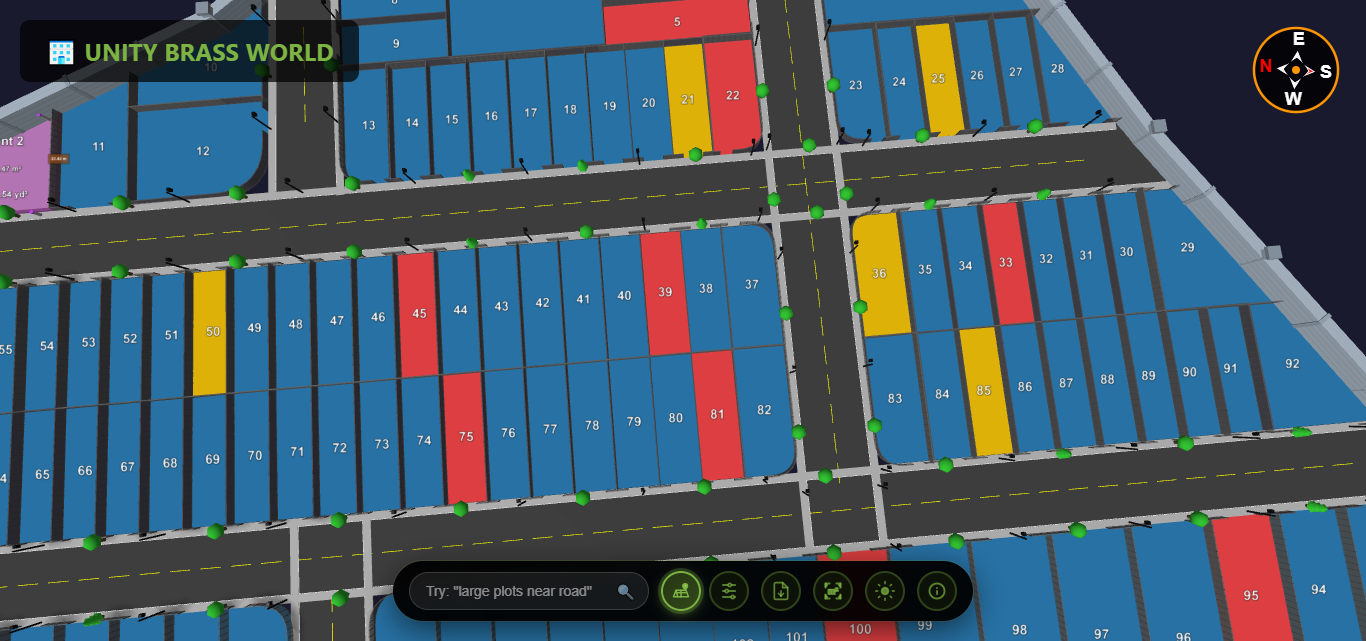
The Better Way: Plotex 3D Plot Visualization
Forget struggling with confusing 2D paper maps. Plotex transforms traditional plot maps into stunning interactive 3D visualizations that anyone can understand instantly. Try our live demo at unity.plotex.in to experience it yourself.
Plotex Features That Make Plot Reading Easy
1. Interactive 3D Navigation
With Plotex, you can rotate, zoom, and pan around the plot from any angle. Unlike flat paper maps, you get a complete understanding of the land layout in seconds. Simply drag to rotate the view and scroll to zoom in on specific areas.
2. Instant Measurements
No more manual calculations with rulers and scales. Plotex provides one-click measurement tools that instantly show you:
- Distance between any two points
- Total plot area in square feet/meters
- Boundary lengths
- Perimeter calculations
3. Clear Boundary Visualization
Property boundaries are clearly highlighted in 3D, making it impossible to misunderstand where one plot ends and another begins. Color-coded boundaries help you identify different property sections instantly.
4. Plot Status Indicators
Plotex shows you the real-time status of each plot:
- Available plots - Ready for purchase
- Sold plots - Already purchased
- Reserved plots - Under negotiation
5. Multi-Device Access
Access your 3D plot maps from any device - desktop, tablet, or mobile phone. Show clients the property on-site using your smartphone, or present to investors on a large screen.
6. Easy Sharing
Share your 3D plot visualization with anyone via a simple link. No apps to download, no software to install - just click and view.
See It In Action: Visit unity.plotex.in to explore a live 3D plot map. Navigate around, measure distances, and see how much easier it is than reading a traditional paper map.